 Table 4 below indicates that overall, 72% of students responded in a positive manner to the 20 selected standards from Items 1, 2 and 4 . However 18% disagreed or strongly disagreed. These responses relate to Standards 1.8, 2.1, 2.6, 2.9, 2.10, 2.13, 4.1, 3.2 and 4.5 . Finally 9% of responses indicated N/A, referring to Standards 2.9, 2.10 and 2.14.
As well as responses to Standards 1, 2 and 4, there was an area at the bottom of the online questionnaire for respondents to write general comments. All responded and feedback was positive.
Data analyses of Staff survey (for quality)
 Table 11 below indicates that overall, 88% of all staff responded in a positive manner to the 20 selectd standards from Items 1, 2 and 4. However 11% indicated a N/A response. Appendix 10 identified one role made these responses and they relate to Standard 1.6, 1.7 and 1.8, and all of Items 2 and 4.
  Table 12 below indicates that overall, 100% of online staff responded in a positive manner to the 20 selected standards in Items 1, 2 & 3 (see also Appendix 9).
Table 12 – Summary of Online Staff only Results shown as % frequencies (n=5) graph
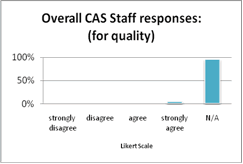
Table 13 below indicates that overall, feedback from the Curriculum & Academic Services staff member indicated that 95% of the selected standards in Items 1, 2 & 4 (see also Appendices 10 and 11) were N/A (not applicable).
As well as responses to structured questions, there was an area for each Item for respondents were able to write comments.
The full version of results are available - click here to access.


Hi Kay
ReplyDeleteYour data is well presented and easy to follow. Showing your data in the form of charts makes it very easy to see the results.
Just one comment - my understanding is that with APA Referencing style, if you have a Table caption, you do not require a heading in the Chart.
Good luck,
Michelle
HI Kay,
ReplyDeleteSeems like you have got very interesting results. Looking at the graph for the overall online staff response - its great to see 100% positive response from that sample.
Very well presented using the graphs :).
All the best for the report.
Reggards
Krishan
ReplyDeleteEWIS e-learning Courses
Please Click Above website here & Get information about EWIS e-learning Courses.